Theory 1
Polar coordinates are pairs of numbers which identify points in the plane in terms of distance to origin and angle from -axis:
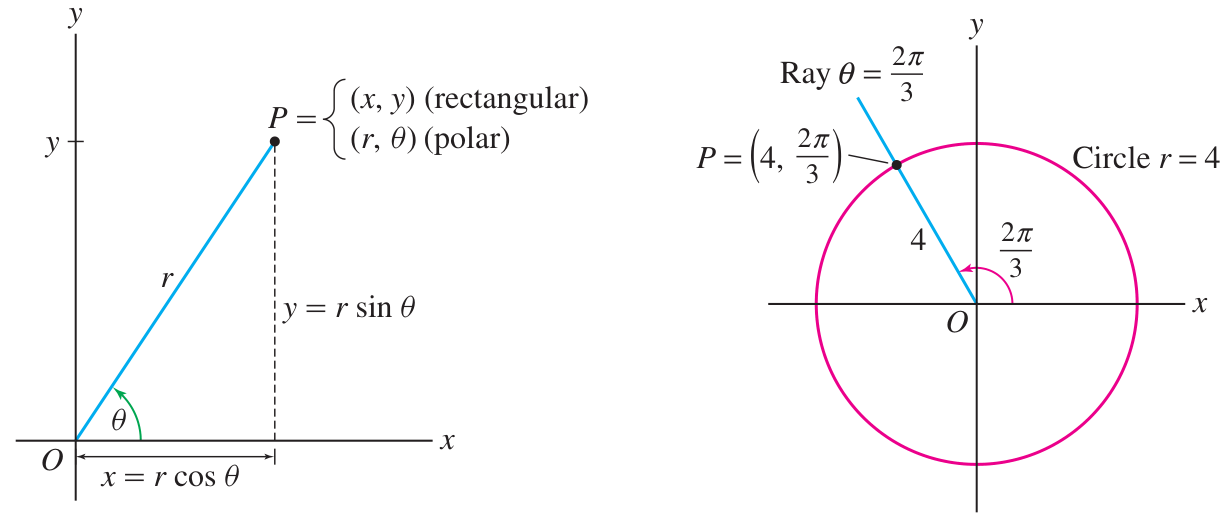
Converting
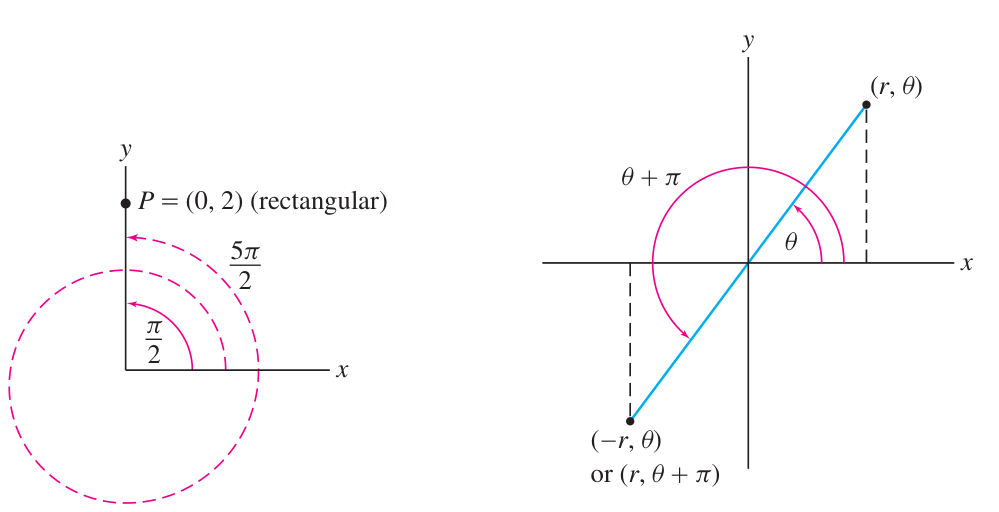
Polar coordinates have many redundancies: unlike Cartesian which are unique!
- For example:
- And therefore also (negative can happen)
- For example: for every
- For example: for any
Polar coordinates cannot be added: they are not vector components!
- For example
- Whereas Cartesian coordinates can be added:
The transition formulas require careful choice of .
- The standard definition of sometimes gives wrong
- This is because it uses the restricted domain ; the polar interpretation is: only points in Quadrant I and Quadrant IV (SAFE QUADRANTS)
- Therefore: check signs of and to see which quadrant, maybe need -correction!
- Quadrant I or IV: polar angle is
- polar angle is
Equations (as well as points) can also be converted to polar.
For , look for cancellation from .
For , try to keep inside of trig functions.
- For example:
Theory 2
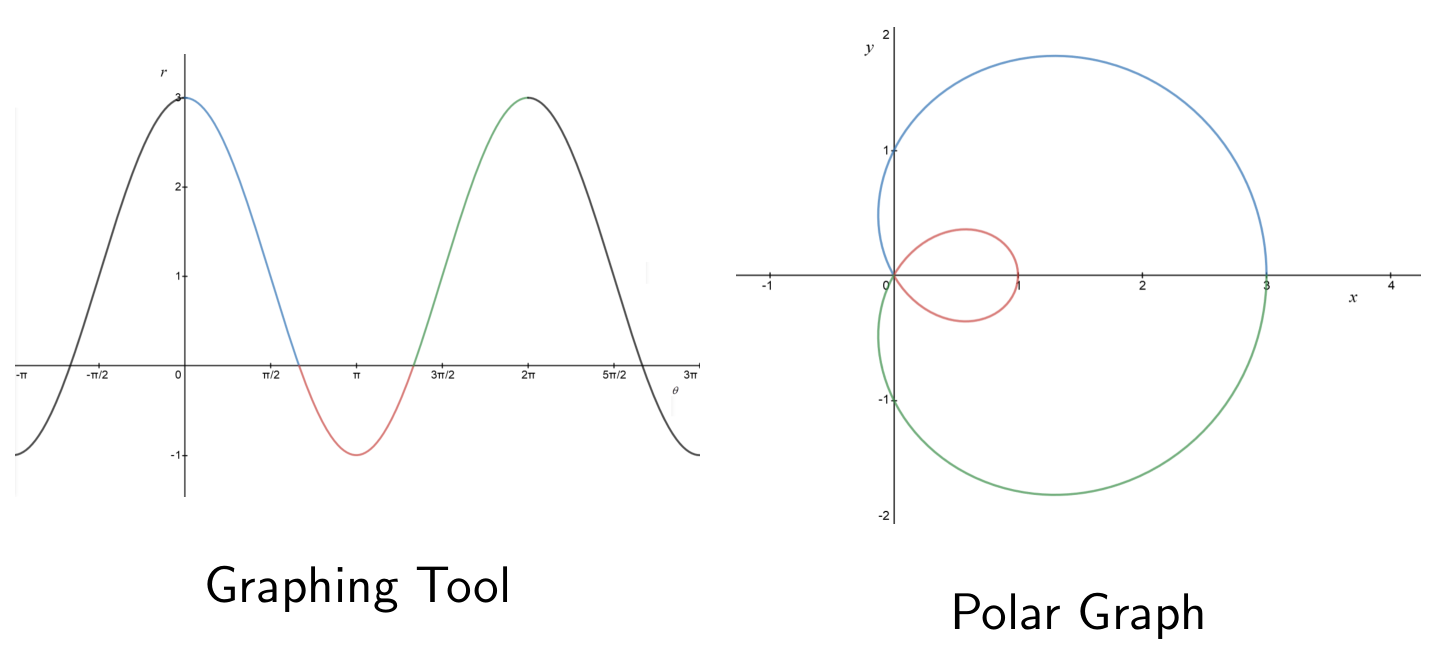
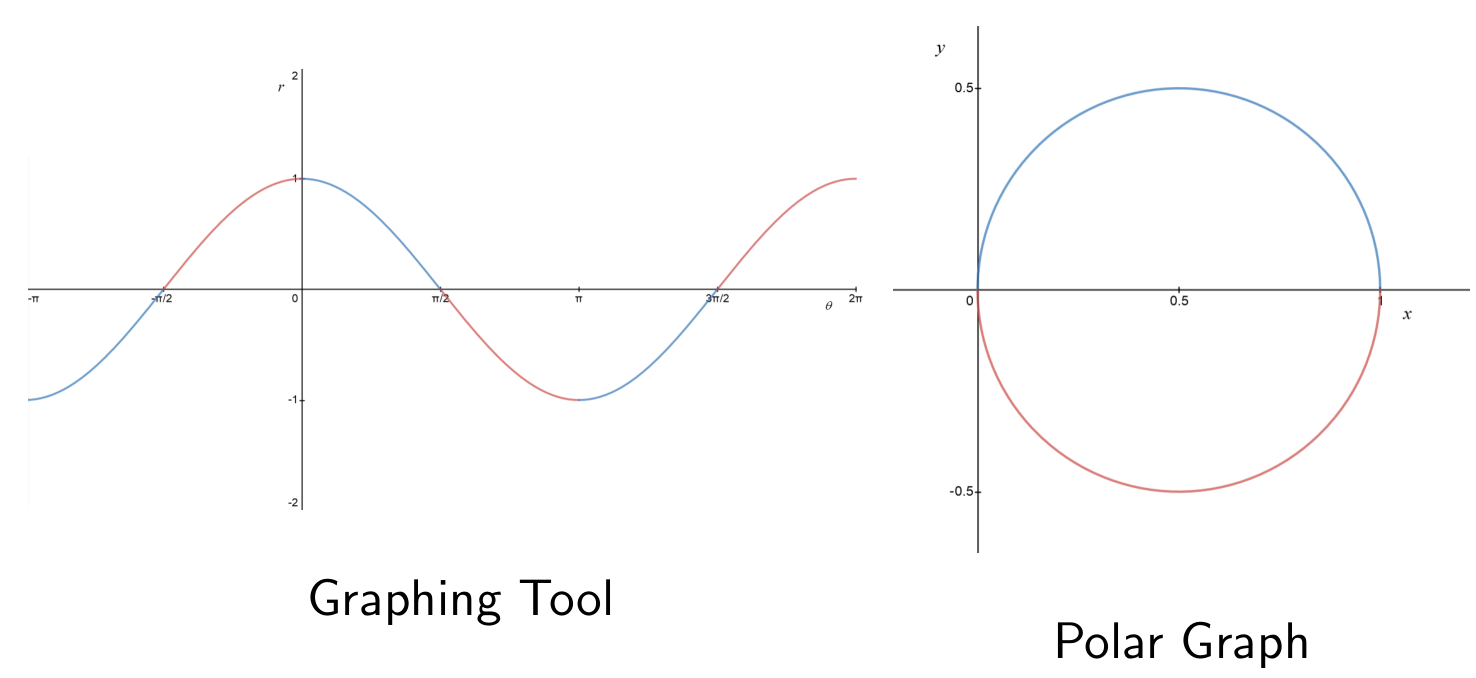
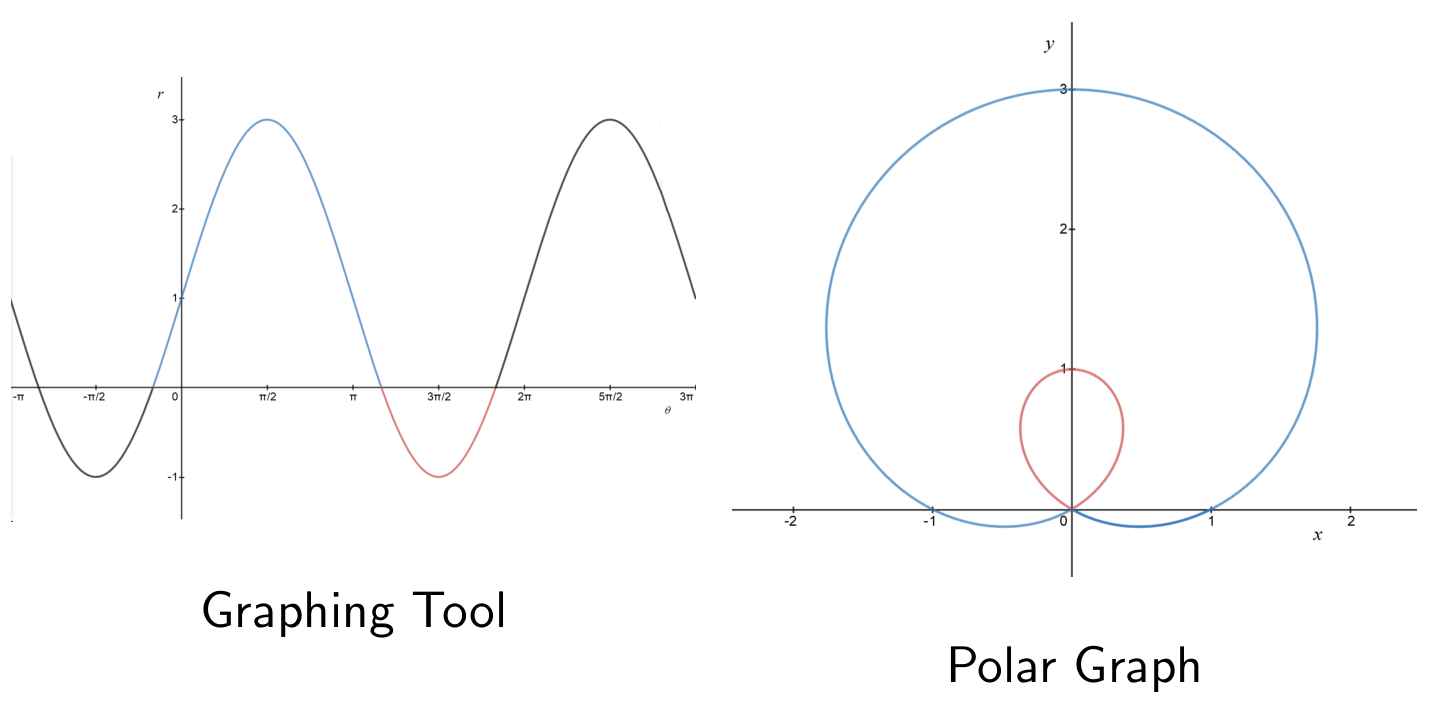
To draw the polar graph of some function, it can help to first draw the Cartesian graph of the function. (In other words, set and , and draw the usual graph.) By tracing through the points on the Cartesian graph, one can visualize the trajectory of the polar graph.
This Cartesian graph may be called a graphing tool for the polar graph.
A limaçon is the polar graph of .
The shape of a limaçon is determined by the value of . Any limaçon can be rescaled to have this form:
: Limaçon satisfying : unit circle.
: Limaçon satisfying : ‘outer loop’ circle with ‘flat spot’, not quite a ‘dimple’:
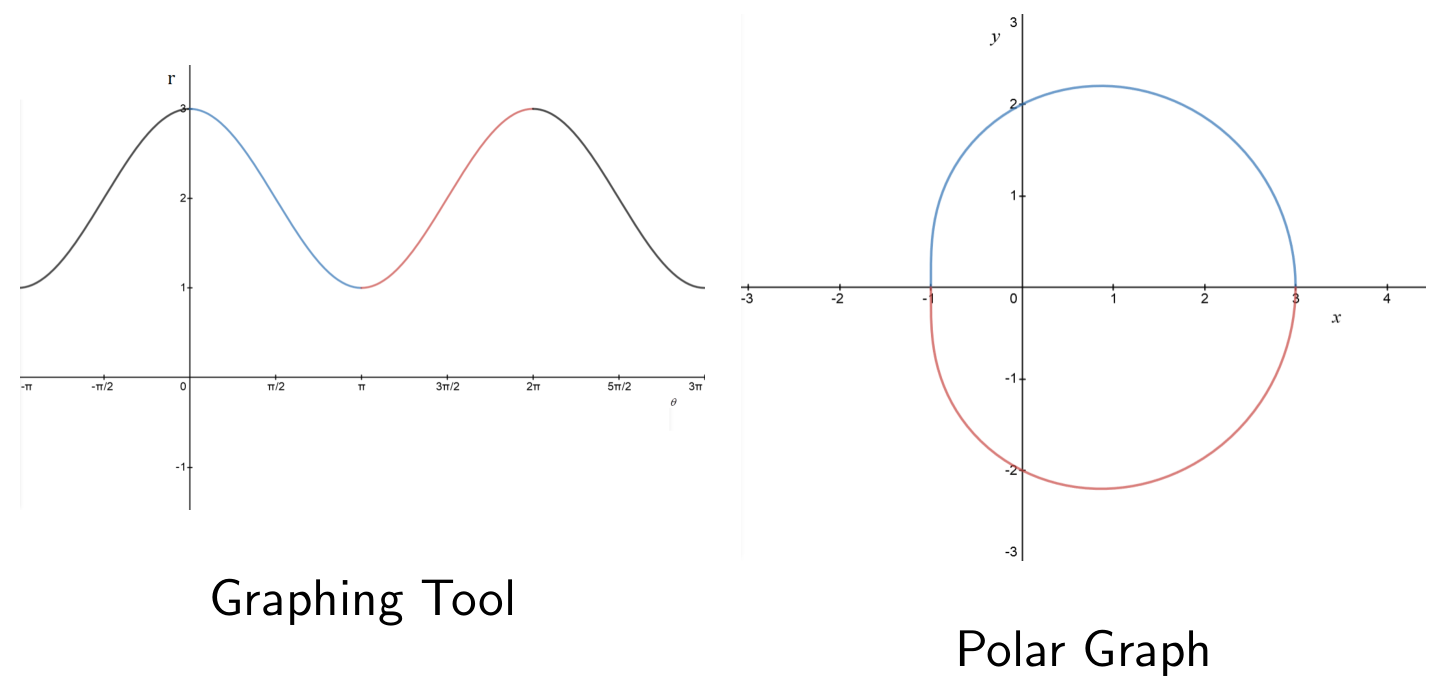
: Limaçon satisfying : ‘cardioid’ ‘outer loop’ circle with ‘dimple’ that creates a cusp:
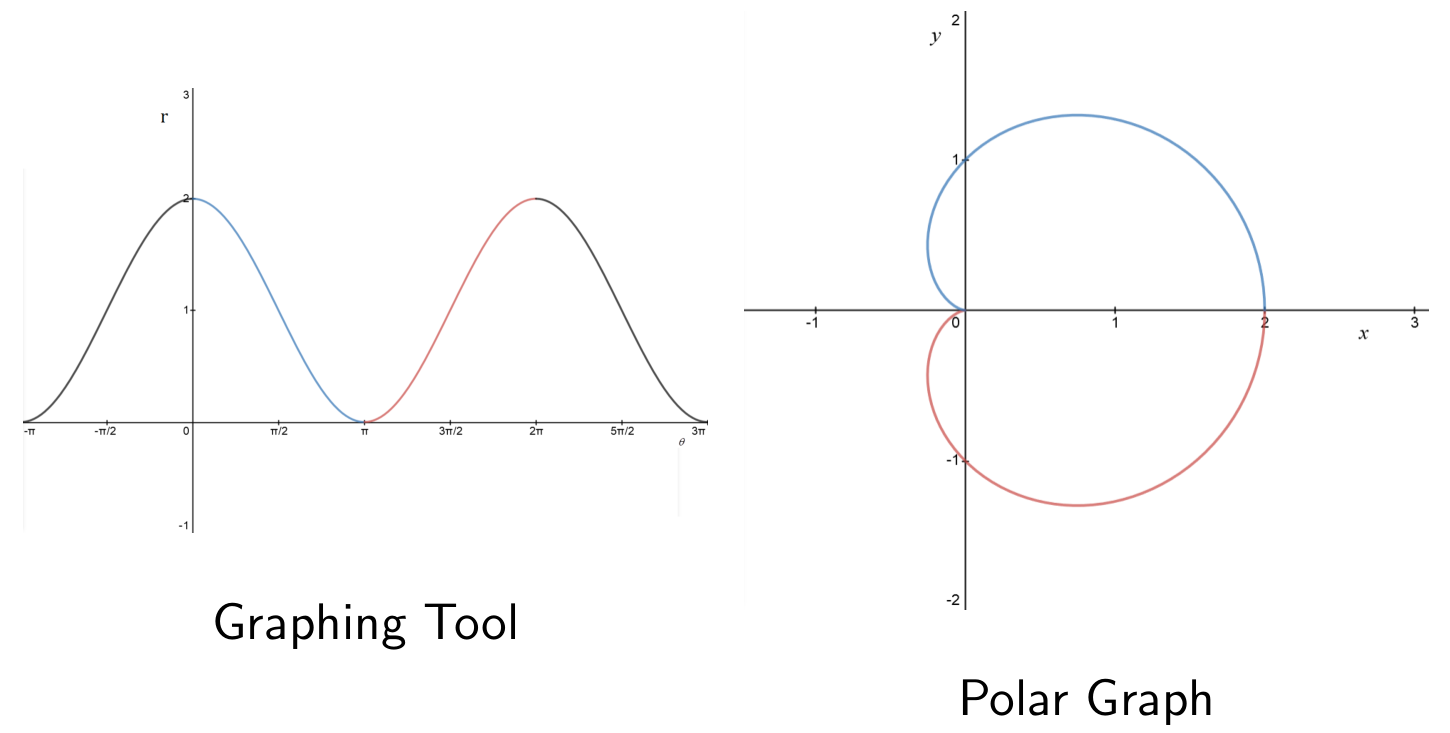
: Limaçon satisfying : ‘dimple’ pushes past cusp to create ‘inner loop’:
: Limaçon satisfying : ‘inner loop’ only, no outer loop exists:
: Limaçon satisfying : ‘inner loop’ and ‘outer loop’ and rotated :
Transitions between limaçon types, :
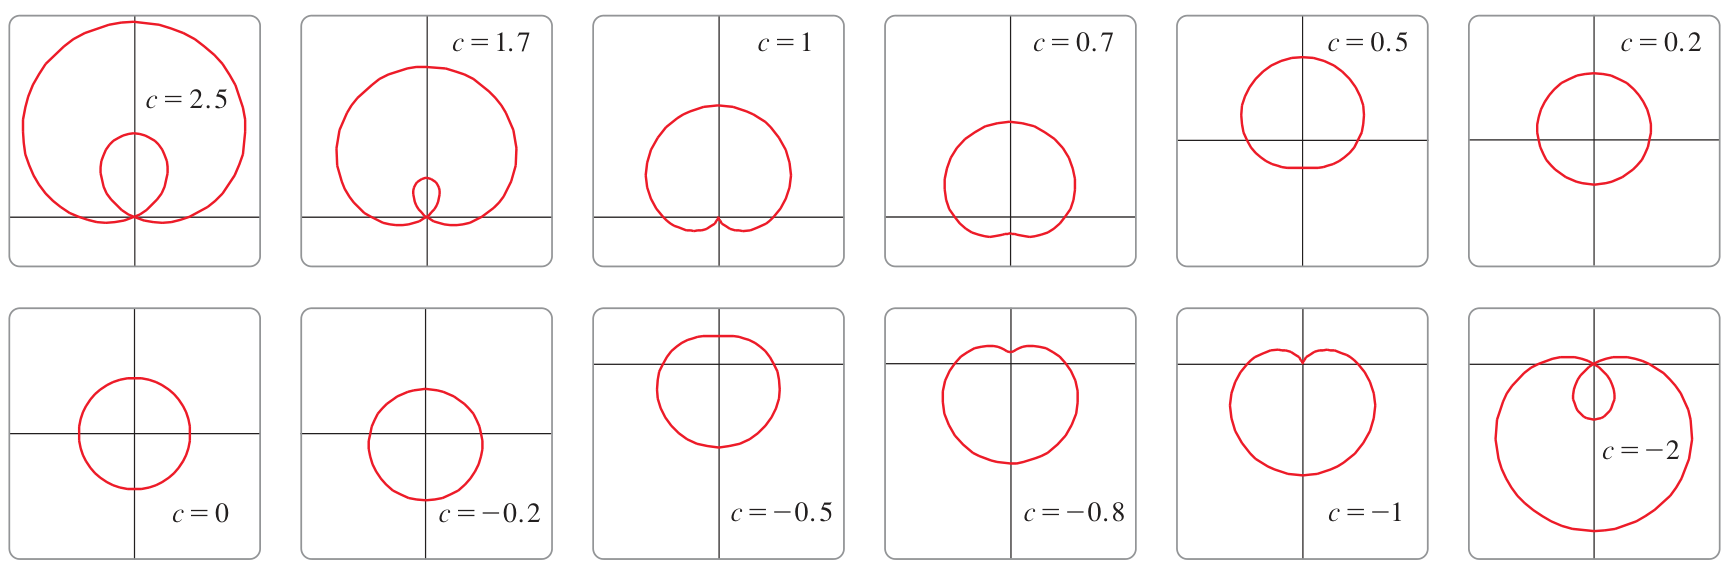
Notice the transition points at and :
The flat spot occurs when
- Smaller gives convex shape
The cusp occurs when
- Smaller gives dimple (assuming )
- Larger gives inner loop
Theory 3
Roses are polar graphs of this form:
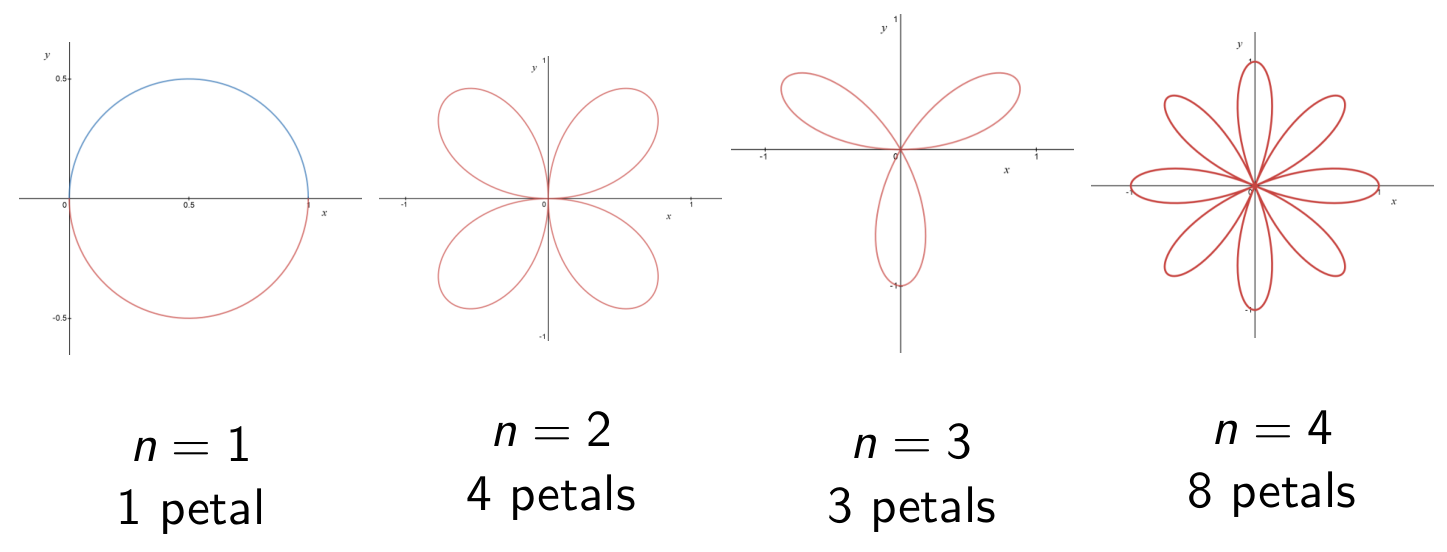
The pattern of petals:
- (even): obtain petals
- These petals traversed once
- (odd): obtain petals
- These petals traversed twice
- Either way: total-petal-traversals: always