Theory 1
A tree diagram depicts the components of a multi-stage experiment. Nodes represent sources of randomness.
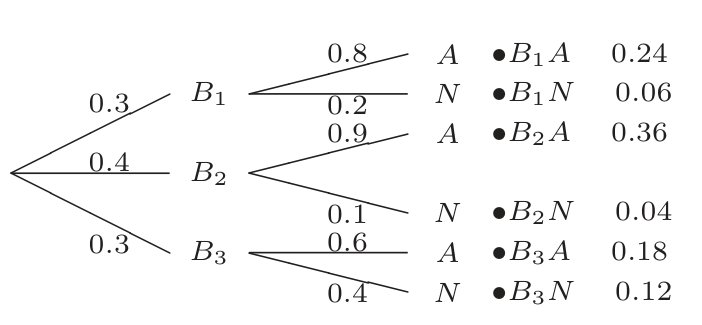
An outcome of the experiment is represented by a complete path taken from the root (left-most node, only one option) to a leaf (right-most node, many options). The branch chosen at a given node represents the outcome of a “sub-experiment.” So a complete path encodes the outcomes of all sub-experiments along the way.
Each branch emanating from a node is labeled with a probability value. This is the probability that the sub-experiment of that node has the outcome of that branch. (In the example, .) This is also the conditional probability of the branch’s right node, given its left node as known.
Therefore, branch values from any given node must sum to 1.
The probability of a given outcome is the product of the probabilities along each branch of the path from the root to that outcome.
For example, for outcome , we have .
Generally, remember that
This overall outcome probability may be written at the final leaf. (Not to be confused with the branch value of the last branch.)
One can also use a tree diagram to remember quickly how to calculate certain probabilities.
For example, what is in the diagram?
- Answer: add up the path probabilities for all paths terminating in . We obtain:
For example, what is ?
- Answer: divide the leaf probability of by the total probability of . We obtain: