Bayes’ Theorem
01 Theory
Theory 1
Bayes’ Theorem
For any events and :
Note: Bayes’ Theorem is sometimes called Bayes’ Rule.
Bayes’ Theorem - Derivation
Start with the observation that , in other words event “ AND ” equals event “ AND ”.
Apply the multiplication rule to each product:
Equate them and rearrange:
The main application of Bayes’ Theorem is to calculate when it is easy to calculate from the problem setup. Often this occurs in multi-stage experiments where event describes outcomes of an intermediate stage.
Note: These lecture notes use alphabetical order , as a mnemonic for temporal or logical order, i.e. that comes first in time, or that is the prior conditional from which it is easy to calculate .
Link to original
02 Illustration
Example - Bayes’ Theorem - COVID tests
Bayes’ Theorem: COVID tests
Assume that 0.5% of people have COVID. Suppose a COVID test gives a (true) positive on 96% of patients who have COVID, but gives a (false) positive on 2% of patients who do not have COVID. Bob tests positive. What is the probability that Bob has COVID?
Solution
(1) Label events:
- Event : Bob is actually positive for COVID
- Event : Bob is actually negative; note
- Event : Bob tests positive
- Event : Bob tests negative; note
(2) Identify known data:
- Know:
- Know:
- Know: and therefore
We seek:
(3) Translate Bayes’ Theorem:
Set and in Bayes’:
We know all values on the right except
(4) Denominator: apply Total Probability (Division into Cases):
Observe that and are exclusive events, and that:
Therefore:
Plug in data and compute:
(5) Plug in and compute:
Link to originalIntuition - COVID testing
Some people find this low number surprising. In order to repair your intuition, think about it like this: roughly 2.5% of tests are positive, with roughly 2% coming from false positives, and roughly 0.5% from true positives. Only of all the positive results are true ones!
(This rough approximation assumes that .)
If two tests both come back positive, the odds of COVID are now 98%.
If only people with symptoms are tested, so that, say, 20% of those tested have COVID, that is, , then one positive test implies a COVID probability of 92%.
Practice exercise
Inferring bin from marble
There are marbles in bins in a room:
- Bin 1 holds 7 red and 5 green marbles.
- Bin 2 holds 4 red and 3 green marbles.
Your friend goes in the room, shuts the door, and selects a random bin, then draws a random marble. (Equal odds for each bin, then equal odds for each marble in that bin.) He comes out and shows you a red marble.
What is the probability that this red marble was taken from Bin 1?
Link to originalSolution
(1) Label events:
- Event : friend chooses Bin 1.
- Event : friend chooses Bin 2.
- Event : friend draws a red marble.
- Event : friend draws a green marble.
Answer will be .
(2) Identify knowns:
- Know .
- Know .
- Know .
- Know .
- Know .
(3) Apply Bayes’ Theorem for ::
Division into Cases for the denominator:
(3) Plug in data and compute:
Independence
03 Theory
Theory 1
Two events are independent when information about one of them does not change our probability estimate for the other.
Independence
Events and are independent when these (logically equivalent) equations hold:
Note that the last equation is symmetric in and :
- Check: and
- This symmetric version is the preferred definition of the concept of independence.
Link to originalMultiple-independence
A collection of events is mutually independent when every subcollection satisfies:
A potentially weaker condition for a collection is called pairwise independence, which holds when all 2-member subcollections are independent:
One could also define -member independence, or -member independence. Plain ‘independence’ means any-member independence.
04 Illustration
Practice exercise
Independence and complements
Prove that these are logically equivalent statements:
- and are independent
- and are independent
- and are independent
Make sure you demonstrate both directions of each equivalency.
Link to originalSolution
(1) Assume and show :
Divide into the cases:
Apply the assumption:
Algebra:
Negation rule:
(2) Assume and show :
Reason the same way as above, but apply the new assumption to break up the second term instead of the first.
(3) Show that and are equivalent:
To do this, simply notice that in the first equivalence we can replace with and with . Use too.
Example - Checking independence by hand
Independence by hand: red and green marbles
A bin contains 4 red and 7 green marbles. Two marbles are drawn.
Let be the event that the first marble is red, and let be the event that the second marble is green.
(a) Show that and are independent if the marbles are drawn with replacement.
(b) Show that and are not independent if the marbles are drawn without replacement.
Solution
(a) With replacement.
Identify knowns:
- Know:
- Know:
Now compute both sides of independence relation:
The right side is .
For , we have ways to get , and total outcomes. So left side is , which equals the right side.
(b) Without replacement. This is a bit harder.
(1) Identify knowns:
Know: and therefore
We seek: and
(2) Find using Total Probability (Division into Cases):
Find RHS factors by counting, then compute:
(3) Find using multiplication rule:
(4) Compare both sides:
Left side: .
Right side:
But so and they are not independent.
Link to original
Tree diagrams
05 Theory
Theory 1
A tree diagram depicts the components of a multi-stage experiment. Nodes represent sources of randomness.
An outcome of the experiment is represented by a complete path taken from the root (left-most node, only one option) to a leaf (right-most node, many options). The branch chosen at a given node represents the outcome of a “sub-experiment.” So a complete path encodes the outcomes of all sub-experiments along the way.
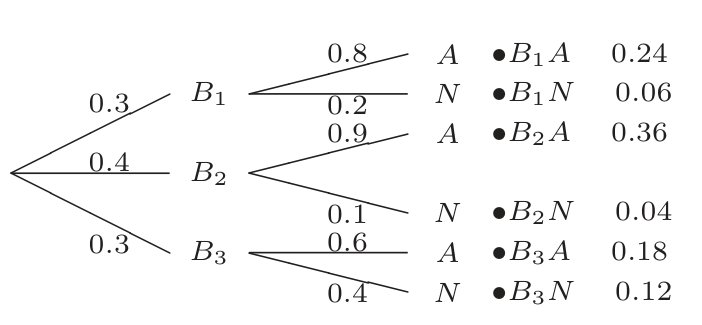
Each branch emanating from a node is labeled with a probability value. This is the probability that the sub-experiment of that node has the outcome of that branch. (In the example, .) This is also the conditional probability of the branch’s right node, given its left node as known.
Therefore, branch values from any given node must sum to 1.
The probability of a given outcome is the product of the probabilities along each branch of the path from the root to that outcome.
For example, for outcome , we have .
Generally, remember that
This overall outcome probability may be written at the final leaf. (Not to be confused with the branch value of the last branch.)
One can also use a tree diagram to remember quickly how to calculate certain probabilities.
For example, what is in the diagram?
- Answer: add up the path probabilities for all paths terminating in . We obtain:
For example, what is ?
Link to original
- Answer: divide the leaf probability of by the total probability of . We obtain:
06 Illustration
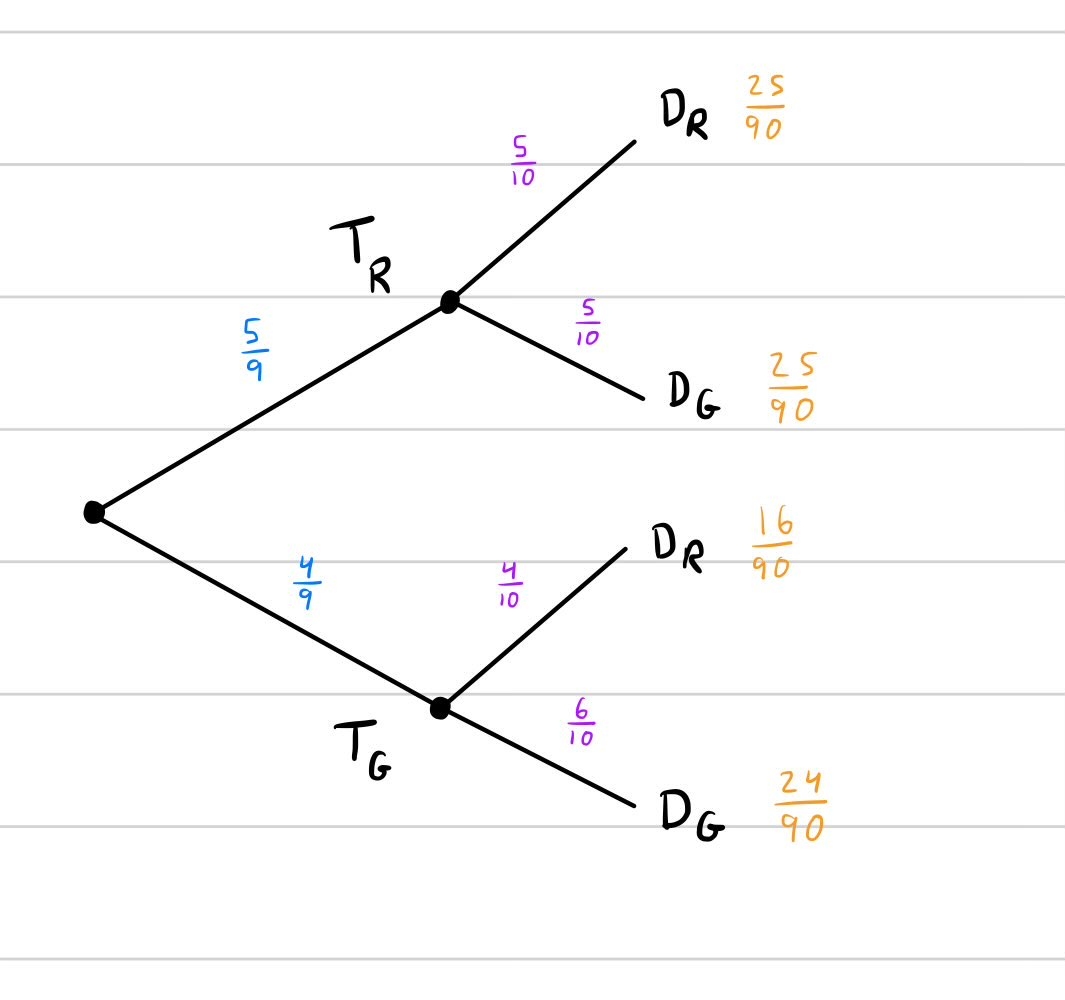
Example - Tree diagrams: Marble transferred, marble drawn
Marble transferred, marble drawn
Setup:
- Bin 1 holds five red and four green marbles.
- Bin 2 holds four red and five green marbles.
Experiment:
- You take a random marble from Bin 1 and put it in Bin 2 and shake Bin 2.
- Then you draw a random marble from Bin 2 and look at it.
Questions:
(a) What is the probability you draw a red marble?
(b) Supposing that you drew a red marble, what is the probability that a red marble was transferred?
Solution
Construct the tree diagram:
Identify sub-experiments, label events, compute probabilities:
(a) Compute :
Add up leaf numbers for at leaf:
(b) Compute :
Conditional probability definition:
Interpretation: value of desired path over value of all possible paths.
Link to original
Counting
07 Theory
Theory 1
In many “games of chance,” it is assumed based on symmetry principles that all outcomes are equally likely. From this assumption we infer a rule for the probability measure .
In words: the probability of event is the number of outcomes in divided by the total number of possible outcomes.
When this formula applies, it is important to be able to count the total outcomes as well as the outcomes that satisfy various conditions.
Permutations
Permutations count the number of ordered lists one can form from a set of items. For a list of items taken from a total collection of items, the number of permutations is:
Why is this formula true?
There are choices for the first item. Then for the second item, after the first has been chosen and removed from the set of possibilities. Then for the third, then …, then for the item. So the total number of possibilities is the product:
We can express this with factorials using a technical observation:
Combinations
Combinations count the number of subsets (ignoring order) one can form from some items. For a subset of items taken from a total collection of items, the number of combinations is:
This formula can be derived from the formula for permutations.
The set of possible permutations can be partitioned into combinations: each combination determines a subset. By additionally specifying an ordering of the elements in a chosen subset, we obtain a permutation. For a given subset of elements taken from items, there are ways to determine an ordering of them in a list. Therefore, the number of permutations must be a factor of times the number of combinations. (For every combination of size , there are ways to order the items in a list.)
The notation is also called the binomial coefficient because it provides the coefficient values of a binomial expansion:
For example:
There are also higher combinations that give multinomial coefficients:
Multinomial coefficient
The general multinomial coefficient is defined by the formula:
where and .
The multinomial coefficient measures the number of ways to partition items into subsets with sizes , respectively.
Notice that , so we have already defined these values (i.e. with ) when we defined binomial coefficients. But when , the formula gives new values. They correspond to the coefficients in multinomial expansions. For example, gives the coefficients for .
Link to original
08 Illustration
Practice exercise
Counting teams with Cooper
A team of 3 student volunteers is formed at random from a class of 40. What is the probability that Cooper is on the team?
Link to originalSolution
There are teams that include Cooper, and teams in total. So we have:
Example - Counting VA license plates
Counting VA license plates
VA license plates have three letters (with no I, O, or Q) followed by four numerals. A random plate is seen on the road.
(a) What is the probability that the numerals occur in strictly increasing order?
(b) What is the probability that at least one number is repeated?
Solution
(a) Numerals in increasing order.
(1) Count total plates:
- Have options for letters.
- Have options for numbers.
Thus possible plates.
(2) Count ways to have 4 numerals that occur in increasing order:
There are ways to choose 4 distinct numerals from 10 options.
For each choice of four distinct numerals (i.e. for each combination), there is exactly one ordering that’s increasing.
Therefore, there are ways to have 4 numerals that occur in increasing order.
(3) Count ways to have a list of 3 letters (excluding I, O, Q).
There are 26 total letters, 3 are excluded, thus 23 options for each letter.
Repetition is allowed, thus we have total ways.
(3) Compute probability:
Total count of desired plates (taking the product of possibilities):
Let label the event that a plate has increasing numerals. The counting formula for probability is:
Evaluate using our data:
(b) At least one number repeated.
“At least” is hard to work with! Lots of ways that can happen.
Try the complement event, which is much simpler: “no repetition”
Let be event that no numbers are repeated. All are distinct. Then is our desired event.
Count the possibilities:
The total number of plates is still .
Therefore, license plates with at least one number repeated:
Desired outcomes over total outcomes:
Link to original
Example - Combinations: Groups with Haley and Hugo
Haley and Hugo from 2 groups of 3
A UVA class has 40 students. Suppose the professor chooses 3 students on Wednesday at random, and again 3 on Friday. What is the probability that Haley is chosen today and Hugo on Friday?
Solution
(1) Count total outcomes:
- We have possible groups chosen Wednesday.
- We have possible groups chosen Friday.
Therefore possible groups in total. (Product of possibilities.)
(2) Count desired outcomes:
The possible groups of 3 that include Haley can be counted by counting the subgroups of 2 formed of the other students in Haley’s group.
- Therefore we have groups that contain Haley.
- Similarly, we have groups that contain Hugo.
Therefore we count total desired outcomes.
(3) Compute probability:
Let label the desired event. By the counting rule:
Evaluate using our data:
Link to original
Counting out 4 teams
Counting out 4 teams
A board game requires 4 teams of players. How many configurations of teams are there out of a total of 17 players if the number of players per team is 4, 4, 4, 5, respectively.
Link to originalSolution
This is just the multinomial coefficient with this data:
17 4 4 4 5 So we have: