Bernoulli process
24 - Binomial variable counting ones in repeated die rolls
A standard die is rolled 6 times. Use a binomial variable to find the probability of rolling at least 4 ones.
Solution
- & Labels
- Let
. - Interpret:
counts the ones appearing over 6 rolls. - We seek
.
- Let
- && Calculation
- Exclusive events:
- Exclusive events:
25 - Roll die until
Roll a fair die repeatedly. Find the probabilities that:
- (a) At most 2 threes occur in the first 5 rolls.
- (b) There is no three in the first 4 rolls, using a geometric variable.
Solution (a)
- & Labels.
- Use
to count the number of threes among the first six rolls. - Seek
as the answer.
- Use
- && Calculations.
- Divide into exclusive events:
- Divide into exclusive events:
(b)
- & Labels.
- Use
to give the roll number of the first time a three is rolled. - Seek
as the answer.
- Use
- && Sum the PMF formula for
. - Compute:
- Compute:
- !! Geometric series formula.
- For any geometric series:
- Apply formula:
- For any geometric series:
- & Final answer is
.
26 - Cubs winning the World Series
Suppose the Cubs are playing the Yankees for the World Series. The first team to 4 wins in 7 games wins the series. What is the probability that the Cubs win the series?
Assume that for any given game the probability of the Cubs winning is
Solution (a) Using a binomial distribution
- & Label.
- Let
. - Thus
is the probability that the Cubs win exactly 4 games over 7 played. - Seek
as the answer.
- Let
- &&& Calculate.
- Use binomial PMF:
- Insert data:
- Compute:
- Convert
:
- Use binomial PMF:
(b) Using a Pascal distribution
-
& Label.
- Let
. - Thus
is the probability that the Cubs win their game on game number . - Seek
as the answer.
- Let
-
&&& Calculate.
- Use Pascal PMF:
- Insert data:
- Compute:
- Convert
:
- Use Pascal PMF:
-
!!! The algebra seems very different, right up to the end!
Expectation and variance
27 - Gambling game - tokens in bins
Consider a game like this: a coin is flipped; if
- Bin 1 contents: 1 token $1,000, and 9 tokens $1
- Bin 2 contents: 5 tokens $50, and 5 tokens $1
It costs $50 to enter the game. Should you play it? (A lot of times?) How much would you pay to play?
28 - Expected value - rolling dice
Let
Then:
The PMF of 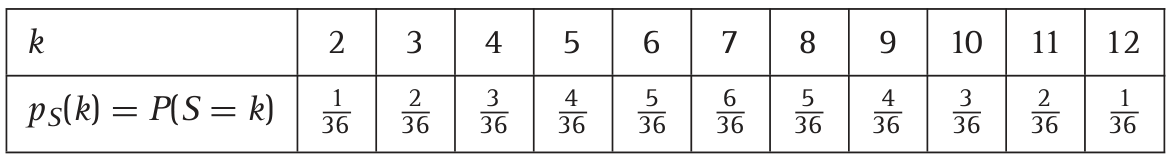 Then:
Then:
- ! Notice that
. - In general,
. - Let
be a green die and a red die. - From the earlier calculation,
and . - Since
, we derive by simple addition!
- In general,
29 - Expectation from PMF of related
Let 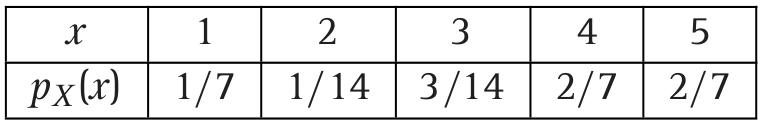
Find
Solution
- &&& Compute the PMF of
. - PMF arranged by possible value:
- PMF arranged by possible value:
- & Calculate the expectation.
- Using formula for discrete PMF:
- Using formula for discrete PMF:
30 - Variance for composite using PMF and simpler formula
Suppose
| 1 | 2 | 3 | |
|---|---|---|---|
| Find |
(Hint: you should find
Poisson process
31 - Poisson calculation
Suppose
Solution
- Conditioning definition:
- Expand numerator:
- Simplify:
- Compute for denominator:
32 - Arrivals at a post office
Client arrivals at a post office are modelled well using a Poisson variable.
Each potential client has a very low and independent chance of coming to the post office, but there are many thousands of potential clients, so the arrivals at the office actually come in moderate number.
Suppose the average rate is 5 clients per hour.
- (a) Find the probability that nobody comes in the first 10 minutes of opening. (The cashier is considering being late by 10 minutes to run an errand on the way to work.)
- (b) Find the probability that 5 clients come in the first hour. (I.e. the average is achieved.)
- (c) Find the probability that 9 clients come in the first two hours.
Solution (a)
- & Convert rate for desired window.
- Expect
clients every 10 minutes. - Let
. - Seek
as the answer.
- Expect
- & Compute.
- Formula:
- Insert data and compute:
- Formula:
(b)
- & Rate is already correct.
- Let
. - Compute the answer:
- Let
(c)
-
& Convert rate for desired window
- Expect 10 clients every 2 hours.
- Let
. - Compute the answer:
-
!!! Notice that 0.125 is smaller than 0.175.
Function on a random variable
33 - Expectation of function on RV given by chart
Suppose that
| 1 | 2 | 3 | |
|---|---|---|---|
| 4 | 1 | 87 | |
| Then: | |||
| And: | |||
| Therefore: |
34 - Variance of uniform random variable
The uniform random variable
- (a) Find
using the shorter formula. - (b) Find
using “squaring the scale factor.” - (c) Find
directly.
Solution (a)
- & Compute density.
- The density for
is:
- The density for
- & Compute
and directly using integral formulas. - Compute
: - Now compute
:
- Compute
- & Find variance using short formula.
- Plug in:
- Plug in:
(b)
- “Squaring the scale factor” formula:
- Plugging in:
(c)
- & Density.
- The variable
will have the density spread over the interval . - Density is then:
- The variable
- & Plug into prior variance formula.
- Use
and . - Get variance:
- Simplify:
- Use
35 - PDF of derived from CDF
Suppose that
- (a) Find the PDF of
. - (b) Find the PDF of
.
Solution (a)
- Formula:
- Plug in:
(b)
- By definition:
- Since
is increasing, we know: - Therefore:
- Then using differentiation:
36 - Probabilities via CDF
Suppose the CDF of
- (a)
- (b)
- (c)
- (d)
Continuous wait times
37 - Earthquake wait time
Suppose the San Andreas fault produces major earthquakes modeled by a Poisson process, with an average of 1 major earthquake every 100 years.
- (a) What is the probability that there will not be a major earthquake in the next 20 years?
- (b) What is the probability that three earthquakes will strike within the next 20 years?
Solution
(a)
Since the average wait time is 100 years, we set
(b)
The same Poisson process has the same